- Home
- Automation
- System Integration
- Data Management

Data Management
Data Logging and Reporting
Kasa provides software that captures all of your "plant floor" data and integrates it to your ERP system. The data provided is collected from numerous entities, devices and equipment that generate different types of data, most of which is essential for company management. Providing real-time/current information in addition to historical information, the integration of an ERP system with a PLC system increases the transparency and visibility of information, allowing management the opportunity to make smarter, more informed decisions.
Most manufacturers have a variety of equipment performing many different functions in their plant. Original Equipment Manufacturers (OEM) in turn, use a variety of controllers to run their equipment. Each piece of equipment and control point in a facility creates data that is often under-utilized. Plant managers are realizing they can be more productive and profitable by:
- combining systems
- capturing all data
- making better business decisions with this data
In addition, regulatory requirements have increased the need to document...everything. Our software gathers data and presents it in a variety of ways or provides it to other systems.
Prescriptive System Control
After systems are integrated and display descriptive data, the next step is to give prescriptive control of the system to the same program that gathers the data. Any piece of equipment, e.g. motors, presses, ovens, dip tanks, washes, etc., that are trending toward unacceptable ranges for amperages, pressure, force, temperatures, acidic measures, etc. are automatically adjusted to acceptable levels before a quality or production level issue occurs.
Predictive Safety, Production and Maintenance Systems
Ultimately, preventing problems is less costly, safer and more productive than reacting to them. Software that recognizes and reacts to dangerous operational condidtions, upcoming production bottlenecks and the need for preventative maintenance offers a cutting-edge advantage.
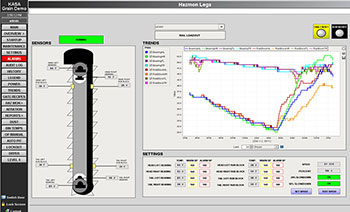
The example at left shows a chart that monitors the temperatures of bearings and rub blocks for a conveyor system. Along with the display of standard current information, the trend screen allows you to compare similar pieces of equipment. The chart helps you determine a point of failure before it happens allowing you to perform predictive maintenance. In this example, you can establish critical set-points and actions to take if set points are reached or exceeded.
Facility Historical Diagnostic View
Diagnosing what happened after the fact can be greatly enhanced when an entire system can be “rewound” to a specific time and day to show graphically the who, what, where and when of any operational problem. This includes the status of every piece of equipment and its safety controls, the most recent alarm history, the preceding trends, the logged in users, etc. Also known as Facility History, this feature provides you with the information to determine the root cause analysis of any shutdown or other unforeseen event.
Our systems capture and log thousands of pieces of data from PLCs or SCADA systems. This allows you to investigate the activities that happened just prior to the shutdown or any event that is under investigation. Using this knowledge, a plant supervisor can determine the processes, people or machinery that are suspect.
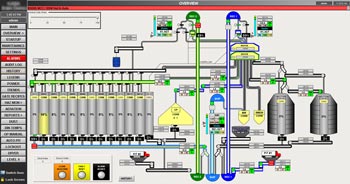
With the example at the right, a grain elevator is able to see everything that was happening at a specific point in time.


